One Month of Continuous Glucose Monitoring with Levels
For one month, in June of 2020, I used a continuous glucose monitor (CGM) with a program from Levels. It was fun to see the impact of small changes in my diet and the data led to meaningful shifts in my behavior.
What is a CGM?
A continuous glucose monitor is a small sensor applied to the skin that can monitor your blood sugar level in real time. It contains a tiny filament that extends a few centimeters into your skin and takes blood sugar readings in between your cells. The sensor includes a transmitter to send the readings to your phone wirelessly and plot it throughout the day. You can add markers for food and exercise so you can see how each affects your blood sugar reading.
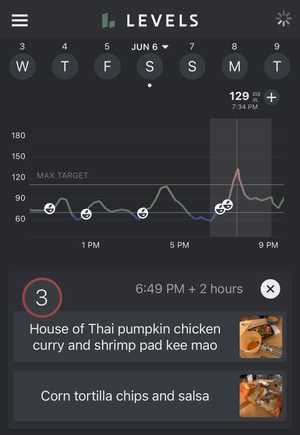
My lunch at around 1pm of Korean-style mapo tofu (mapadubu) barely registered. I then had a small bowl of Ben and Jerry's ice cream around 3:30pm. At 7pm, I had a Thai dinner of pumpkin curry and Pad Kee Mao. The Thai food had quite an impact on my blood glucose!
Why CGM?
There is a lot of information on the Internet about which foods and diets are "healthy". It's hard to know what is effective and what isn’t. Furthermore, diets that claim to be the most effective generally require drastic changes in food habits, making them harder to stick to.
The reality is that everyone responds to food in different ways. Our genetics, physical make-up, and other factors can all influence how diet affects our bodies. It doesn't make sense to treat blanket recommendations as applicable to everyone.
Still, there is substantial evidence that elevated glucose levels and post-meal glucose spikes can lead to insulin resistance and metabolic dysfunction over time and increase risk of a lot of major diseases. If you want more of an in-depth look into why this is the case, I recommend the Levels Blog and the article on creating an optimal diet through CGM.
By helping you track your glucose levels, continuous glucose monitoring gives you a personalized guide on how different foods impact your body. You can get immediate feedback after each meal and workout and modify your behavior based on what you see.
Interesting Findings
Glucose spikes for carbohydrates combined with fat and/or protein
One use of monitoring blood glucose is to see how the body reacts to different combinations of foods. In a departure from the typical calories in/calories out model, scientists say that the physiological effects of diet are not only determined by the total net calories of foods consumed during the day, but also determined by the nutritional content of the foods as well as the way the foods are consumed1.
The CGM allowed me to test how my body reacts to carbohydrates when consumed in isolation compared to when consumed in combination with fats and protein.
On the first day of the experiment, June 13th, I woke up and ate one serving of freshly cooked oatmeal along with eggs cooked in 2 tablespoons of butter. On the second day of the experiment, June 14th, I woke up and ate one serving of freshly cooked oatmeal, plain. In both versions, I did not add any other carbohydrates (such as fruit, sugar, or bread).
Carbohydrates + Fat
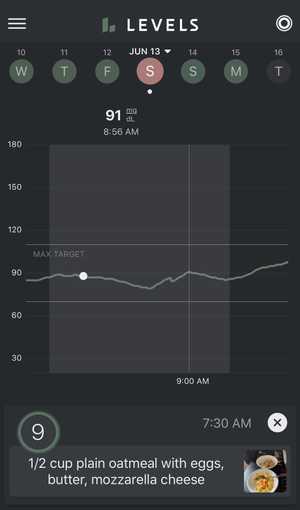
On the first day, when I ate the oatmeal with eggs, I had the following blood glucose response. You can see that there is barely a spike, peaking at 91 mg/dL approximately 90 minutes after eating the carb + fat oatmeal breakfast.
Carbohydrates alone
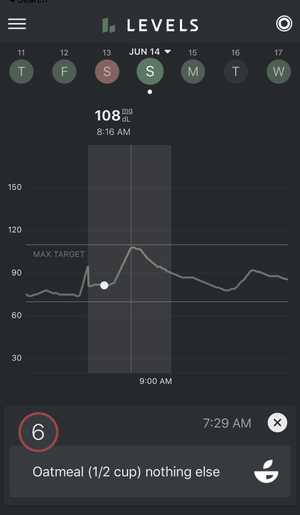
On the second day, when I ate oatmeal alone, I had a different blood glucose response. You will notice that there is a much higher spike, peaking at 108 mg/dL approximately 45 minutes after eating the carb-only oatmeal breakfast.
This pattern of blood glucose spikes applied to other forms of carbohydrates as well. I was pretty surprised to find that different desserts caused different blood glucose spikes depending on when and how I ate them.
Pastries and cakes consistently caused massive spikes. However, ice cream didn't always cause the same sharp blood glucose spike, even though the overall sugar content was comparable in each type of dessert. The difference was most likely the added fat and protein coming from the dairy in the ice cream. Based on the data from the CGM, I could argue that my body was able to handle the glycemic load from ice cream better than other desserts that have less protein and fat.
Blood glucose dependent on intensity of exercise
The past three years have taken me on the journey of longer and longer triathlons. I aim to one day complete an Ironman, which would likely take 12+ hours.
We store between 2000-3000 calories of energy in the form of glycogen which enters as glucose into the bloodstream. Our body also stores between 20-30 thousand calories in fat. I can burn through the entire glycogen store and more in a six hour bike ride. To finish an additional run and swim, I would need to either replenish all the glycogen-based calories through food or burn calories stored in body fat. The former is very difficult, but the latter requires training.
Triathlon training guides suggest that the body consumes fat at lower intensities and carbohydrates (glycogen and blood glucose) at higher intensities. It is recommended to do many low-intensity workouts to train the body to burn fat instead of carbohydrates for long races.
I was curious to find the intensity ranges that did and did not require consuming glycogen. I used heart rate as a proxy for intensity. By measuring my blood glucose, I could see if I was turning glycogen into glucose that was entering my bloodstream and being consumed during exercise.
Low Intensity
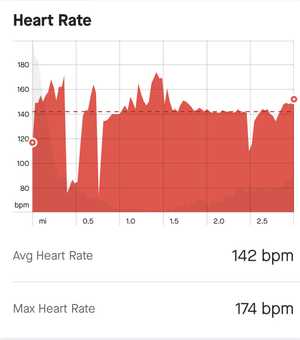
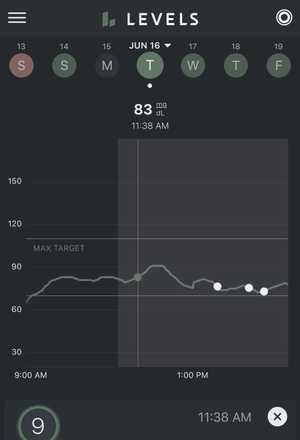
On June 16th, I went on a 30 minute long, low intensity run, with an average heart rate of 142 beats per minute (bpm). For context, my maximum heart rate is approzximately 200 beats per minute.
My heart rate fell during two brief moments and increased above 142 on three occasions, but otherwise it stayed pretty close to 142 bpm. Overall, I spent 73.9% of my run in Zone 2 (118-156 bpm) which is considered “low intensity” training.
My blood glucose started at 85 mg/dL and went up to 91 mg/dL about 20 minutes into the run before dipping back down to 79 mg/dL 30 minutes after the run.
High Intensity
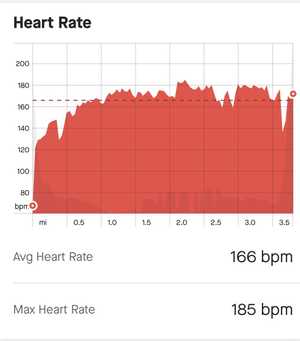
On June 18th, I then went on a high intensity run, with an average heart rate of 166 bpm.
My heart rate was fairly elevated throughout the run and stayed between 160 and 180 bpm.. Overall, I spent 53.2% of my run in Zone 3 (156-175 bpm) and 27.9% of my run in Zone 4 (175-195 bpm) which is considered “high intensity” training.
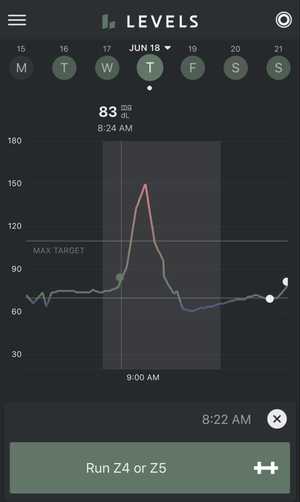
My blood glucose started at 80 mg/dL. Over the course of the run, it spiked up to 150 mg/dL before dipping down to 75 mg/dL 30 minutes after the run.
The experiment showed a drastic difference in my body's blood sugar during low intensity and high intensity workouts. During low intensity (Zone 2) training, my blood glucose barely registered a spike. During high intensity (Zone 4) training, my blood glucose showed a drastic spike.
This confirmed that at high intensities, my body was converting lots of glycogen into glucose into my bloodstream to feed my muscles. At low intensities, my body was not converting as much glycogen into glucose and was likely burning more fat. This is valuable information I will use when training for my next triathlon.
Affecting Behavior Through Measurement
I have found that the best way to create long-standing change in something is to measure it. By receiving immediate feedback on how my body reacted to my diet and exercise, I was able to make adjustments to reach my goals. Without any measurements, it is a little bit like flying a plane without an airspeed indicator.
High Glucose Events
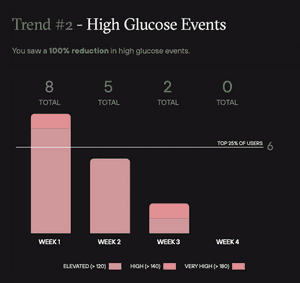
Over the four week program, I saw a 100% reduction in high glucose events. High glucose and repeated spikes are strongly correlated with inflammation, high insulin, and cardiometabolic dysfunction2.
This reduction may be a bit drastic and perhaps a sign I was overzealous with my carbohydrate restriction by Week 4. However, many of the habits that I changed over the four weeks have sustained even after I've stopped using my CGM. I believe that the CGM data played a big part because I could see the immediate effects of my changes in behavior.
Average meal score
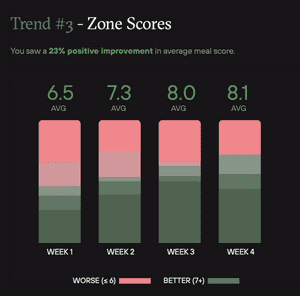
The Levels program assigned a score from 1-10 to all my meals, which I was able to track with a picture and short description in the app. The score was based on the post-meal blood glucose response to the meal. A score above 7 was considered better. Over the four week program, my average meal score improved by 23%, again likely because I was able to see exactly what score each of my meals was given.
Gamification
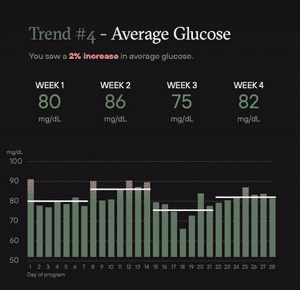
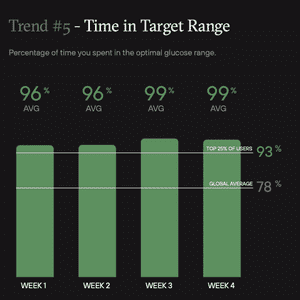
At times, the Levels program felt like a game. I was challenging myself to reduce the variability on my average glucose and stay within the target range which was below 100 with a standard deviation less than 15. The positive feedback when I succeeded gave me the satisfaction to push forward and ignore my unhealthy food cravings.
What's Next?
Keep more variables constant
During my experimentation, I was not as diligent as I would have liked in limiting the number of variables. These variables could have been confounding factors in my results. Some examples are:
- Time of day of meals. If the experiment was breakfast, how long before breakfast was my previous meal?
- Overall activity level that day
- Amount of sleep the night before
In future iterations, I would like to do a better job of measuring these variables and keeping them constant if I'm not testing them explicitly.
Effects of fasting on blood glucose
In 2021, I have started experimenting with fasting, with each fast lasting 24+ hours. Next time I try Levels, I’d like to see the effects on 24-72 hour fasts on blood glucose during and after the fast. How does exercise affect my blood glucose during the fast? Does my body process the same foods differently after a 24 hour fast compared to normal circumstances?
Additional experimentation
- Does exercise affect how my body processes carbohydrates? The same foods, eaten after a long run or bike ride, resulted in a much smaller blood glucose spike. I love a good pastry and it's nice to know that I can eat them after a workout with less guilt.
- Does walking before or after meals affect my blood glucose?
- Does eating carbs first vs carbs last during a meal make a difference on my blood glucose?
- How do various fruits affect my blood glucose?
Closing Remarks
While the technology is too expensive for widespread usage in its current form — Levels cost $199/month — I believe continuous glucose monitoring is one component in the future of personalized medicine. I hope scientists and technologists continue to better understand the benefits of continuous glucose monitoring in maintaining metabolic health and bring down the cost of bringing these devices to the masses.
Notes
-
Hall, Kevin D et al. “Energy balance and its components: implications for body weight regulation.” The American journal of clinical nutrition vol. 95,4 (2012): 989-94. doi:10.3945/ajcn.112.036350
↩ -
Blaak, E E et al. “Impact of postprandial glycaemia on health and prevention of disease.” Obesity reviews : an official journal of the International Association for the Study of Obesity vol. 13,10 (2012): 923-84. doi:10.1111/j.1467-789X.2012.01011.x
↩
